


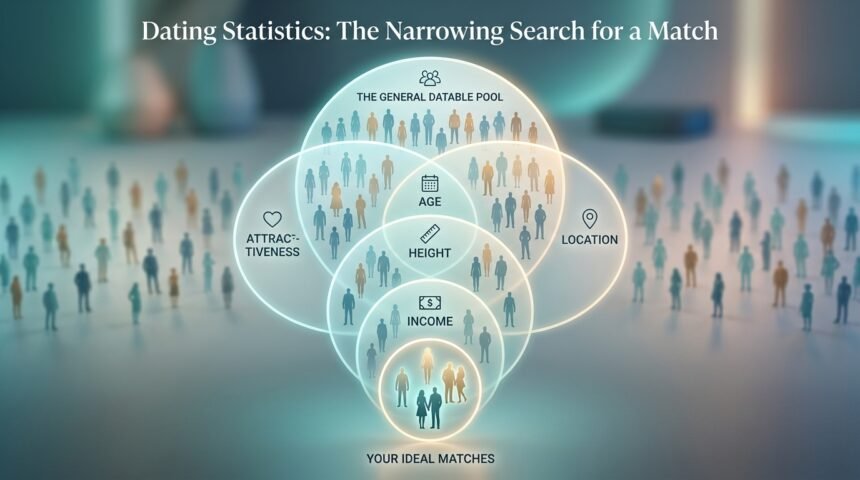
Dating standards are a normal part of modern relationships. People often have preferences about age, height, education, income, lifestyle, appearance, location, and relationship history. Having preferences is not necessarily a problem. The interesting question is how common it is for one person to meet several of those preferences at the same time.
- Why Dating Standards Can Be Difficult to Evaluate
- The Mathematics Behind a Dating Pool
- What Is a Delusion Calculator?
- Why One Requirement May Not Tell the Whole Story
- Height, Income, and Age
- The Difference Between Preferences and Expectations
- Why Online Dating Can Make the Numbers Feel Different
- Statistical Probability Is Not Compatibility
- How to Use a Dating Calculator Responsibly
- Start With Your Real Preferences
- Experiment With Different Filters
- Don’t Treat the Score as a Judgment
- Consider Geographic Differences
- Why Data Can Improve Self-Awareness
- Dating Standards Can Change Over Time
- A Better Way to Think About Dating Statistics
- Conclusion
A person may want a partner who is within a particular age range, has a certain income, is physically fit, has a specific educational background, and lives nearby. Each requirement might seem reasonable on its own. However, when several requirements are combined, the available dating pool can become much smaller.
This is where demographic statistics and probability can provide an interesting reality check. Instead of relying entirely on assumptions or anecdotes, people can use publicly available population data to understand how common certain combinations of characteristics actually are.
Why Dating Standards Can Be Difficult to Evaluate
People usually develop dating preferences from personal experiences, cultural expectations, social media, entertainment, family influences, and their own goals. These influences can make certain characteristics appear more common than they really are.
Social media can be especially misleading because users are frequently exposed to highly selective examples. Someone might regularly see successful professionals, attractive couples, people traveling internationally, or individuals showing expensive lifestyles. Over time, this can create an impression that these characteristics are typical when they may actually represent a relatively small portion of the population.
Dating apps can create a similar effect. Users are presented with a limited selection of people who meet certain algorithmic or geographic criteria. The people visible on one platform may not accurately represent the entire population.
Statistics can help put those observations into context.
For example, suppose someone wants a partner who falls into a particular age range, meets a minimum income requirement, has a certain height, and is unmarried. Each requirement eliminates some people from the potential pool. When those requirements are combined, the resulting group may be considerably smaller than expected.
The Mathematics Behind a Dating Pool
The basic idea is relatively simple.
Imagine a population in which 50% of people meet one particular requirement. If another independent requirement is also met by 50% of people, combining the two does not leave 100% of the population. Instead, the theoretical combined proportion would be around 25%.
This illustrates why multiple preferences can have a compounding effect.
Consider a simplified example:
- 50% meet requirement A
- 40% meet requirement B
- 30% meet requirement C
- 20% meet requirement D
If those factors were completely independent, multiplying the proportions would produce:
50% × 40% × 30% × 20% = 1.2%
That does not mean exactly 1.2% of real people will meet all four requirements. Real-world characteristics are often related to one another, and demographic datasets have their own limitations. However, the example demonstrates why several filters can dramatically reduce the size of a theoretical dating pool.
This is one reason a person may be surprised when they calculate how many people actually meet all of their preferred criteria.
What Is a Delusion Calculator?
A delusion calculator is an online tool designed to estimate how large a dating pool remains after applying multiple preferences.
The term is usually used in a humorous or informal way. It does not mean that a person is clinically delusional or that their preferences are inherently wrong.
Instead, the concept is essentially a statistical reality check.
A user can enter characteristics such as a preferred age range, minimum height, income level, education, marital status, or other criteria. The calculator then estimates what percentage of the relevant population meets the selected conditions.
For example, Delusion Scale provides a free calculator that allows users to experiment with different dating standards and see how the combination affects the potential pool. The tool describes its methodology as using U.S. Census demographic data along with CDC statistics.
The result is intended to make an abstract idea easier to understand.
Instead of saying, “I want someone who meets these six requirements,” a person can see how those requirements interact statistically.
Why One Requirement May Not Tell the Whole Story
Looking at individual statistics can sometimes be misleading.
Suppose a person says they want a partner earning at least $100,000 per year. That requirement might still leave a significant number of potential partners.
Now add an age requirement.
Then add a height requirement.
Then exclude married people.
Then add an education requirement.
The final pool may be much smaller than the initial income-based estimate suggested.
This is the key distinction between looking at individual demographic statistics and examining combinations of characteristics.
A person may discover that none of their individual preferences is particularly rare, while the exact combination of all their preferences is uncommon.
Height, Income, and Age
Three characteristics frequently discussed in dating conversations are height, income, and age.
Height is particularly interesting because it follows a population distribution. Requiring a minimum height eliminates everyone below that threshold. A requirement such as being six feet tall, for example, represents a much smaller group than simply being above average height.
Income works similarly. Setting a high minimum income removes a large portion of the population from consideration. Income can also vary significantly by age, location, education, and occupation, meaning it should not always be treated as an isolated variable.
Age is another important factor. A narrow preferred age range naturally creates a smaller pool than a broad range.
When these characteristics are combined, the reduction can become significant.
That does not mean people should abandon their preferences. It simply means they may want to understand the statistical consequences of those preferences.
The Difference Between Preferences and Expectations
There is an important distinction between having preferences and expecting a specific outcome.
Someone can reasonably prefer a partner with a particular career, income, lifestyle, or physical characteristic. The existence of a small statistical pool does not make that preference invalid.
However, understanding the size of the pool can help someone make more informed decisions.
For example, a person might decide that a particular characteristic is essential while other characteristics are flexible. Another person may realize that several requirements are preferences rather than genuine deal-breakers.
The value of a statistical calculator is therefore not necessarily to tell people what they should want. Instead, it can show what their current criteria imply about the size of their potential dating pool.
Why Online Dating Can Make the Numbers Feel Different
Online dating does not provide access to the entire population.
Users typically search within a particular geographic radius and may also filter by age, interests, religion, education, lifestyle, or other characteristics. Dating platforms may additionally use algorithms to determine which profiles users see.
As a result, the practical dating pool can be much smaller than the theoretical population pool.
Location is particularly important.
A preference that is relatively common across the entire United States might be much less common in a specific city or region. Conversely, a person living in a large metropolitan area may have access to a much larger potential pool than someone living in a small community.
This is why a national statistical estimate should be viewed as a broad reference point rather than a guarantee of how many compatible people someone can actually meet.
Statistical Probability Is Not Compatibility
This is perhaps the most important limitation.
A person can meet every demographic requirement and still be completely incompatible with another person.
Age, height, income, education, and marital status do not measure personality or chemistry. They do not tell you whether two people communicate well, share similar values, respect one another, or enjoy spending time together.
A statistical calculator can estimate whether someone is common or uncommon within a particular demographic group. It cannot predict whether a relationship will succeed.
This distinction is important because numbers can sometimes appear more authoritative than they actually are.
A result such as “2%” should not be interpreted as meaning that only 2% of those people would make good partners. It simply means that the selected combination of characteristics is estimated to occur in approximately 2% of the modeled population.
How to Use a Dating Calculator Responsibly
A calculator can be most useful when treated as an educational or entertainment tool rather than a definitive relationship test.
Here are several ways to use one responsibly.
Start With Your Real Preferences
Instead of entering criteria simply because they sound impressive, begin with the characteristics that genuinely matter to you.
For example, consider whether income is truly a requirement or whether financial responsibility is more important. Similarly, ask whether a specific height is essential or simply a preference.
Experiment With Different Filters
One of the most interesting ways to use a calculator is to change one requirement at a time.
Run the calculation with a minimum income requirement, then remove it.
Try a narrow age range, then expand it.
Add a height requirement and see how the result changes.
This can show which criteria have the greatest statistical impact.
Don’t Treat the Score as a Judgment
A low percentage does not mean someone has bad standards.
It simply means the selected combination of characteristics is less common.
Likewise, a high percentage does not mean someone has found the perfect formula for dating success.
The number describes the population, not the quality of a future relationship.
Consider Geographic Differences
National statistics can be useful for general context, but local demographics can be very different.
Someone living in New York City, Los Angeles, Dallas, or a rural community may have access to very different dating populations.
Therefore, national estimates should not be interpreted as a precise prediction of someone’s local dating experience.
Why Data Can Improve Self-Awareness
One benefit of using statistics is that they encourage people to question assumptions.
A person might believe that a particular combination of characteristics is relatively common because they frequently encounter examples online. A statistical estimate can challenge that assumption.
The opposite can also happen. Someone may believe their preferences are extremely rare when the underlying population data suggests that a sizable group actually meets them.
In both cases, the number can provide useful context.
The goal is not necessarily to lower standards. Instead, it is to understand the trade-offs involved in maintaining a particular set of requirements.
Dating Standards Can Change Over Time
Preferences are not always permanent.
Someone in their early twenties may prioritize different characteristics than someone in their thirties or forties. Career goals, family plans, financial circumstances, location, and previous relationship experiences can all influence what people want.
This means a dating pool calculation should be viewed as a snapshot rather than a permanent assessment.
A person can also decide that certain preferences are negotiable after gaining more experience.
For example, someone might initially prioritize income but later realize that shared financial goals matter more than a specific salary. Another person might prefer a narrow age range but become more flexible after meeting people outside that range.
Flexibility can change the statistical size of the potential pool considerably.
A Better Way to Think About Dating Statistics
Instead of asking, “Are my standards delusional?” a more useful question may be:
“How common is the combination of characteristics I am looking for?”
That question removes some of the judgment from the conversation.
It also recognizes that preferences are personal.
Someone may knowingly choose to pursue a very small dating pool because certain characteristics are particularly important to them. Another person may prefer a larger pool and be willing to compromise on several preferences.
Neither approach automatically guarantees better results.
Statistics simply provide information that can help people understand the trade-offs.
Conclusion
Dating preferences are personal, but the population behind those preferences can be measured.
Age, income, height, education, marital status, and other demographic characteristics can each reduce the size of a potential dating pool. When several requirements are combined, the effect can be much larger than people initially expect.
Tools such as a delusion calculator can make these statistical relationships easier to understand. By experimenting with different criteria, users can see how individual preferences affect the overall size of a theoretical dating pool.
However, the results should always be interpreted carefully. Demographic statistics cannot measure attraction, personality, emotional compatibility, shared values, communication, or relationship quality. A statistical estimate is therefore a reality check—not a prediction of someone’s romantic future.
The most useful approach is to treat the numbers as information rather than judgment. Understanding the statistics can help people recognize which preferences are essential, which are flexible, and how their choices influence the size of their potential dating pool.
Ultimately, dating is about people rather than percentages. Statistics can explain how common certain characteristics are, but meaningful relationships still depend on factors that no calculator can completely measure.